Saturday, October 31, 2015

Indian economy reading links

Indian economy reading links

1. More confirmation that India's middle class may be much smaller than originally thought comes from the latest Credit Suisse Global Wealth Databook 2015. It finds a middle class of just 24 million adults, less than a fourth of China. This is confirmed by findings of recent Pew survey, the Government of India's own socio-economic and caste census, and by the income tax assessee base.
The report also finds disturbing trends on wealth dispersion, with the richest 1% and 10% Indians respectively owning 53% and 76.3% of the country's wealth, far more unequal than the US where the top 1% own 37.3% of the total wealth.
Highlighting the rapid widening of inequality, even as the national wealth rose by $2.284 trillion in the 2000-15 period, the richest 1% and 10% respectively claimed 61% and 81% of the increment.

2. More dismal news from Credit Suisse through the latest version of its status report on the debt levels of India's ten most indebted infrastructure firms. Their cumulative debt has risen seven-fold over the past eight years to reach 12% of all bank loans and 27% of all corporate loans, with debt levels rising for all the ten groups. Their interest cover dropped to 0.8 in 2014-15 from 0.9 in 2013-14, despite a significant share of interest being capitalized, and debt/EBITDA rose to 7. 
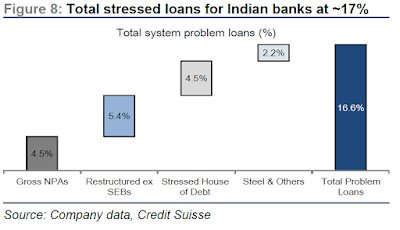
While the loans are standard in the bank books, 35-65% of the debt of four groups have been downgraded to default by rating agencies. In fact, the report points to auditor findings that 48% of the total debt, or $53 bn, was in some form of default, with $37 bn for 0-90 days and $16 bn for more than 90 days. It also estimates that 20-90% of the loans for some groups, aggregating to $48 bn or equivalent to declared banking sector gross NPAs, may be under severe stress. Taking all these into the count, the report estimates that the total NPA of India's banking system could be close to 17%.
Some of the groups have sold away their better-performing assets to raise capital, leaving them with an even greater struggle to repair their balance sheets. Faced with such levels of balance sheet problems, these firms have cut back on capital expenditure by 20-70%. Most worryingly, many projects have 20-70% cost over-runs, thereby pushing capital costs beyond their pre-loss replacement costs and leaving the projects unviable. 

It is most certain that many of these projects will have to be restructured with large haircuts and/or further equity infusions, maybe even public support. The aggressive traffic forecasts and tariff estimates that formed the basis of financial closure in road and power projects respectively may be impossible to realize. This coupled with the accumulated interest during construction and construction cost escalation may have made many projects insolvent. Any simple rescheduling of loans may be merely kicking the can down the road. 

3. Rajan Govil joins those questioning the GDP growth numbers based on underlying indicators. He points out that nearly three-quarters of August's 6.4% annual IIP growth are explained by four items - gems and jewelry, insulated rubber cables, heavy commercial vehicles, and electricity - whose out-sized growth rates are simply unsustainable. He also points to the unabated trend of declining credit growth - non-food credit growth was 8.4%, and that to industry and services was 5-6%. 

4. A new report by Bain and Co estimates private equity (PE) investments in India to touch $22.3 bn in 2015, exceeding the previous record of $17.1 in 2007. With this, PE would make up more than half the FDI into India.  
While this is an encouraging trend, its details need to be carefully parsed. Investments in consumer technology (e-commerce, aggregators, and other sharing economy firms), real estate, and financial services collectively made up 65% of all inflows and those into manufacturing is marginal. By its very nature, PE investors generally take positions in existing firms. A few large deals make up a disproportionate share of all PE investments - the top 25 deals made up 49% of 2014 PE investments. Finally, as the graphic below shows, the potential inflows from such sources is very small.
In any case, as I have blogged earlier, all such sources are a rounding error when compared to the country's credit needs, the overwhelming majority of which is met by the banking sector.

my reading


1. Polio is the new cross-border threat for India from Pakistan,
Experts warn that neighboring India, which succeeded in shedding its label as a polio-endemic nation three years ago, could face serious cross-border infection.
As immunization efforts flounder in Taliban-controlled northwest regions, the number of Polio cases reported have been growing, thereby raising the specter of cross-border infection. Yet another reason why India needs a stable and developing Pakistan.

2. Livemint has a graphic on judicial vacancies and case loads.

3. Arguably one of the most important macroeconomic debates in recent years has been over the relative superiority of fiscal austerity or expansion in combating economic weakness in developed economies. Two contrasting tales from both sides of the Atlantic.

In Spain, the Conservative Popular Party has pursued a vigorous austerity policy, slashing public spending in the middle of a recession and pushing through a series of labor reforms to improve external competitiveness. It has achieved internal devaluation through wage compression - wages have fallen in nine of the last fourteen quarters since the PP government assumed power. These measures appear to have succeeded, with output estimated to grow by 3% this year, Spanish exports have grown fastest rising from a share of 17% of GDP in 2007 to 23% in 2014, the number of Spanish companies selling abroad has risen 50% in the same period, and unemployment though still high has been declining. In contrast, in Canada, the center-left Liberal Party of Justin Trudeau recently won elections on an avowedly Keynesian platform.

4. Times points to this paper that evaluated the impact of seven cash transfer programs in Mexico, Morocco, Honduras, Nicaragua, Philippines, and Indonesia and found "no systematic evidence that cash transfer programs discourage work" and thereby promote lazy behaviors.

5. Business Standard points to another price transmission problem in India, in piped natural gas (PNG) distribution in cities. An 18% recent reduction in the regulated (by indexation) upstream price of natural gas (from $4.66 mBtu to $3.82 mBtu due to fall in global oil prices) translated to a mere 3% cut in the PNG price for consumers. As of June 2015, India had 2.8 PNG consumers in 11 states. 
The Indian Supreme Court had in July 2015 ruled that the Petroleum and Natural Gas Regulatory Board (PNGRB) had no powers to regulate transmission through CGD network and could only determine tariff for gas transmission through common or contract carrier pipelines. It, therefore, rejected PNGRB's claim to fix retail city gas prices. City gas distribution (CGD) firms are, therefore, currently monopolies and enjoy freedom from price regulation. They have marketing exclusivity for the first five years of their operations. Subsequently, the CGD network would be on "open-access", available to third parties to supply gas as a "common carrier", thereby ushering competition in the closed market. Once they become "common carriers", the PNGRB would have the regulatory powers to fix tariffs. However, the challenge then would, in all likelihood, be to get the incumbent network owners to not sabotage the open access arrangement. 

6. The digital traces left by mobile phones have emerged as one of the most exciting areas of studying human behavior in real-time, with the potential to frame public policy accordingly. Here are a few applications. 

LogAnalysis software developed by Emilio Ferrara and Co of Indiana University analyzes social networks developed from telephone calls (chiefs of gangs makes a few calls to trusted lieutenants who in turn disseminate the same widely and repeatedly) and compares them with crime data to identify (and pre-empt) criminals and crime locations. Adeline Decuyper and Co in Belgium monitored food consumption patterns by superposing an FAO household survey data with mobile phone calls data from Rwanda and found that airtime top ups correlated with purchases of high-value food items. Kevin Kung and Co at MIT used data from Ivory Coast, Portugal, and Boston and found that humans spent an hour daily commuting, independent of distance or mode of transport or the country, thereby validating the old Marchetti's constant (they assumed people's homes as where they made calls in the night and office as the location of calls during working days). Vasyl Palchykov and Co use the duration and frequency of telephone calls from a database of nearly 2 billion calls (age and sex of the callers were available) to tease out the changing patterns of relationships between men and women at different ages. Jameson Toole and Co use mobile data to study the economic and social impact of mass lay-offs by analyzing the changes in people's social networks. 

7. Andres Velasco points to the findings of Tulane University's Commitment to Equity Institute, which examined the impact of various fiscal policy instruments (direct taxes, indirect taxes, direct transfers, indirect subsidies like food and energy prices, and in-kind transfers like education and health care services) on inequality and poverty for Brazil, Chile, Colombia, Indonesia, Mexico, Peru, and South Africa,
The largest income redistributive effect is in South Africa and the smallest in Indonesia. Success in fiscal redistribution is driven primarily by redistributive effort (share of social spending to GDP in each country) and the extent to which transfers/subsidies are targeted to the poor and direct taxes targeted to the rich. .. South Africa’s result can be attributed to the combination of a large redistributive effort with transfers targeted to the poor and direct taxes targeted to the rich... While fiscal policy always reduces inequality, this is not the case with poverty. Fiscal policy increases poverty in Brazil and Colombia (over and above market income poverty)... meaning that a significant number of the market income poor (nonpoor) are made poorer (poor) by taxes and transfers. This startling result is primarily the consequence of high consumption taxes on basic goods... 
The marginal contribution of direct taxes, direct transfers, and in-kind transfers is always equalizing. The marginal effect of net indirect taxes is un-equalizing in Brazil, Colombia, Indonesia and South Africa. Total spending on education is pro-poor except for Indonesia, where it is neutral in absolute terms. Health spending is pro-poor in Brazil, Chile, Colombia and South Africa, roughly neutral in absolute terms in Mexico, and not pro-poor in Indonesia and Peru.
They calculate the marginal contribution of a tax or transfer (as the difference in inequality gini with and without the intervention) and the total redistributive effect (difference between market income gini and disposable or post-fiscal (disposable income plus indirect subsidies minus indirect taxes) incomes gini). 
Several counter-intuitive findings stand out - regressive taxes in Chile and South Africa are equalizing or neutral; the marginal contribution of contributory social security old-age pensions is un-equalizing in Chile, Mexico and Peru. 

Given this heterogeneity, to the question of whether direct taxes or indirect taxes and direct transfers or in-kind transfers are more effective at lowering inequality or reducing poverty, one can only say that "it depends" on its interaction with the other fiscal policy instruments already in operation.

Friday, October 23, 2015

The one graphic about India's learning outcomes that you should see

The one graphic about India's learning outcomes that you should see

The conventional wisdom on learning outcomes is that the country's state government public schools and low-end private schools are where the problem lies and their troubles have to do with poverty and other social issues. And that the remaining part of the country's education system is in good shape and those students can compete with the best in the world. This belief gets entrenched by the excellent performance of Indian students in international Math and Science competitions as well as the dominance of graduates from IITs etc in various professional fields.     

So, it comes as a surprise (HT:Lant Pritchett) when we examine the relative performance of Indian students at the top end of the achievement spectrum in the 2009 PISA tests which assessed a representative sample of students from the two best performing Indian states, Himachal Pradesh and Tamil Nadu. As can be seen, less than a percent of students in both states were above Level 4 (out of six levels) in the PISA test. The contrast with those countries that we aspire to match or even claim equivalence, atleast for the best and brightest among Indians, is staggering.
The comfort that we are better off comes from a cognitive bias. The immediacy of these kids engenders an availability bias, which makes people feel as though the schools where their children are going are as good as anything in the world. Sure, there are outliers, and they are the top 0.1% (or maybe 1%) or so of the schools.