- Tax-free bonds from the secondary market
- 7.75% Government of India taxable bonds 2018
- Bank fixed deposits Corporate fixed deposits (pertaining to large institutions)
- PSU Perpetual Bonds like SBI, PNB and BOB
- Mutual Funds: Wherein capital protection is given a premier preference i.e. specific categories such as Short-Term Debt Funds, Arbitrage Funds, along with Overnight and Arbitrage Funds.
Wednesday, June 24, 2020
What is the best investment strategy today?
"This time it's different"- Bear Markets And What We Can Learn From History
April 2020 - The uncertainty and panic surrounding the Covid-19 crisis has led to rollercoaster stock markets. The extreme volatility is worrying for investors and one question I am frequently being asked is “Have we seen the bottom yet?”
At this point the answer to this question is guess work. It all depends on how quickly we are able to contain the virus, how quickly a cure and a vaccine can be found and how quickly regular economic activity can be resumed.
However, since I first started investing in Emerging Markets back in 1987 we have experienced a number of crises and bear markets including the Asian financial crisis, the subprime mortgage crisis and others. We have also witnessed and profited from the recoveries that followed. While this particular crisis is unique in the scale of the actions taken by governments around the world and their effect on economic activity, as regards to the reactions of stock market investors around the globe there are similarities to previous stock market crashes.
Some say that this bear market is unique and we have never experienced anything like this before. But it’s important to remember that, as someone once said: “This time is different’ are the most expensive words in the world.” Human behaviour tends to follow predictable patterns because of built-in emotions that make us human.
So what can we learn from history that will enable us to make better investment decisions in times of crisis? Looking at previous bear markets can provide some indication on what we might expect in the current market environment and going forward. Therefore we took some time to study 11 stock markets (U.S, U.K., Turkey, Korea, China, Taiwan, Brazil, Japan, Thailand, India and Hong Kong ) and their bear markets since the end of the 1980s. We have not included the current bear market since it may not have ended yet.
The Global Picture
We define a bear market as a decline of 20% or more over a period of at least two months. If this was followed by a 20% rise over a period of at least two months we considered a subsequent fall of 20% or more a new bear market. Because international investors are usually more interested in U.S. Dollar returns we have chosen USD indices rather than the local currency ones.
Based on these indices the average bear market decline was about 49% across all markets but the declines ranged from a low of 23% to a high of 92%. In terms of the length of time a bear market lasted (from the peak of the bull market to the lowest point in the bear phase) on average over a year, to be precise about 15 months. But the range was from a few months to over three years. As one would expect the Emerging Markets proved more volatile than the developed markets with more bear markets, a higher average decline of 51% and a shorter duration of about one year.
But let’s have a look at the individual markets. (Please note we are not yet counting the recent market downturn).
U.S.
Examining the world’s largest market, the U.S., we focused on the S&P 500 Index and found that since 1987 the market experienced only three bear markets, excluding the current one. Those three bear markets averaged a 47% decline and ranged between a low of 34% and a high of 57%. The length of time of the bear markets ranged between three months and three years and averaged 17 months.

U.K.
In the U.K. the market (in USD terms) was more volatile than in the U.S. Since 1987 the FTSE 100 Index (USD) experienced six bear markets with declines ranging between 65% and 23% with the average being 38%. Like the U.S. the average length of time was 17 months for the bear markets with a range of 4 months to three years.

Turkey
Turning to emerging markets, we found that the Turkish market was highly volatile. This is one reason why this market has been very attractive to some investors who love volatility since it provides them with more opportunities.
During the time period starting in 1988 the Turkish market experienced 10 bear markets which showed an average decline of 64% with a range of between 81% and 46%. The average length of the bear markets was 14 months but ranged between a high of three years and a low of 4 months.

Korea
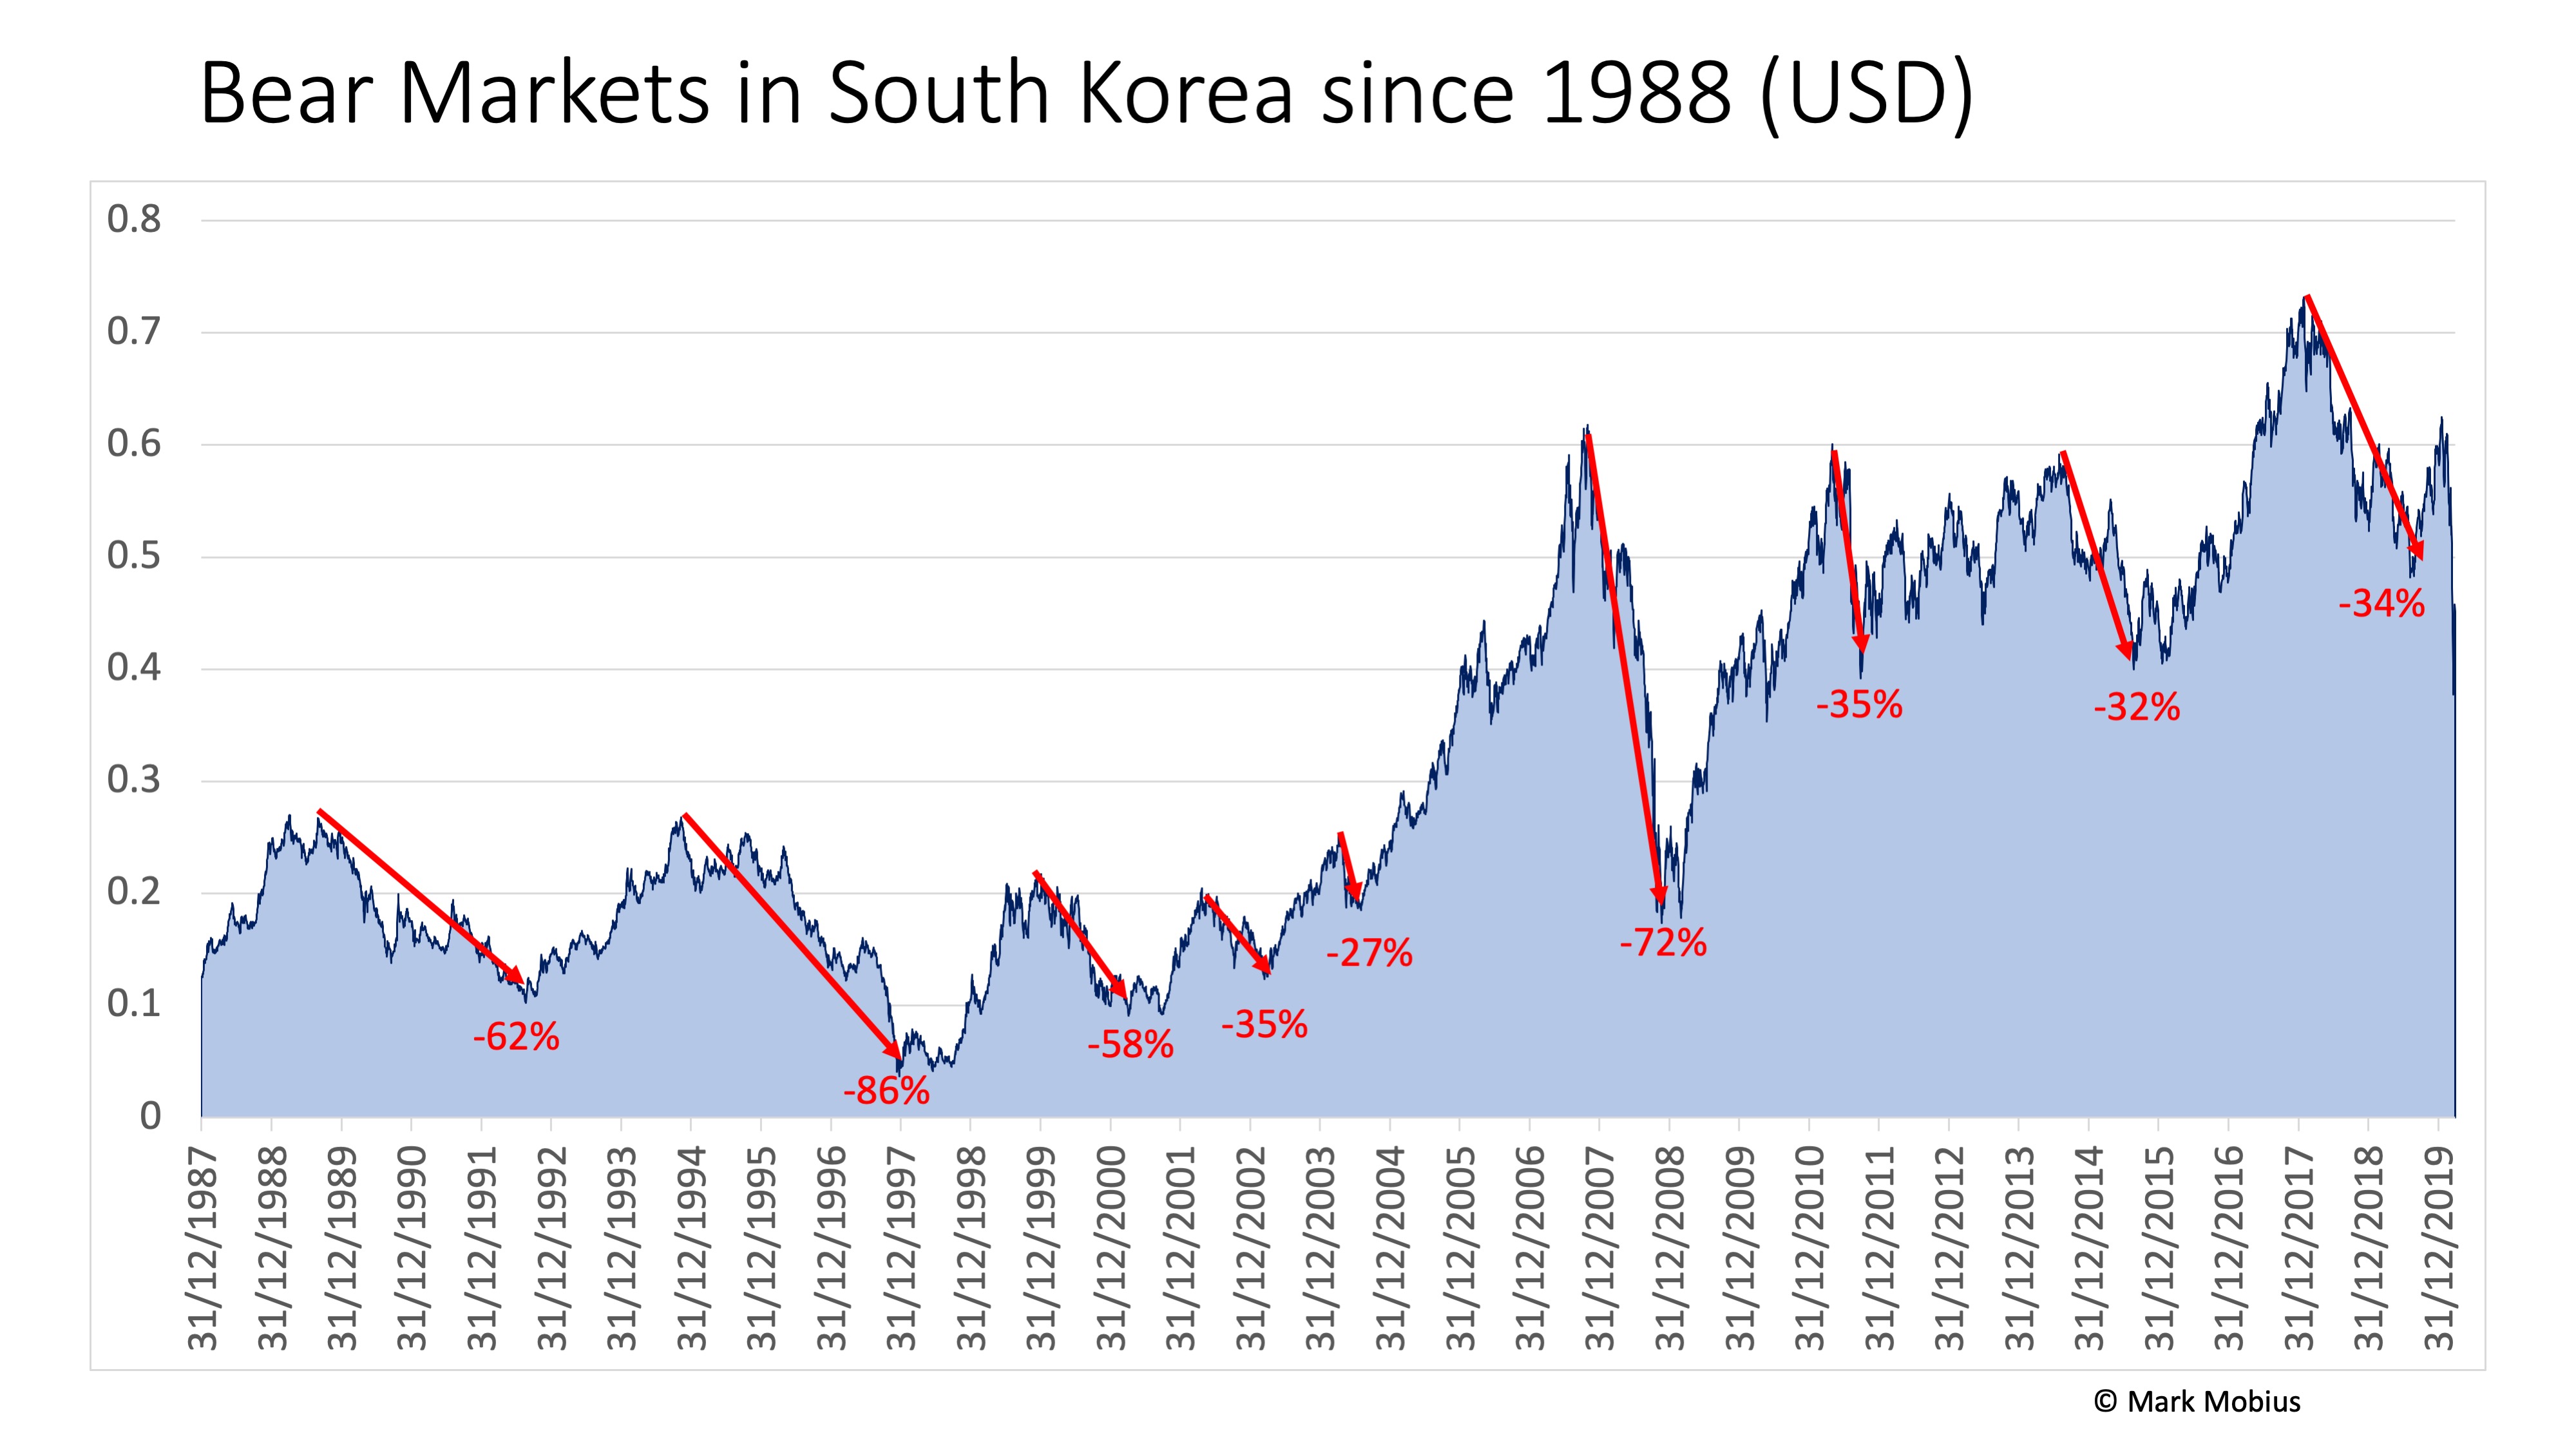
Next on our list was Korea, another volatile market with nine bear markets. Those bear markets averaged a decline of 49% ranging from a low of 27% to a high of 86%. The average time length of all the bear markets was 17 months and ranged between 4 months and three years.

China
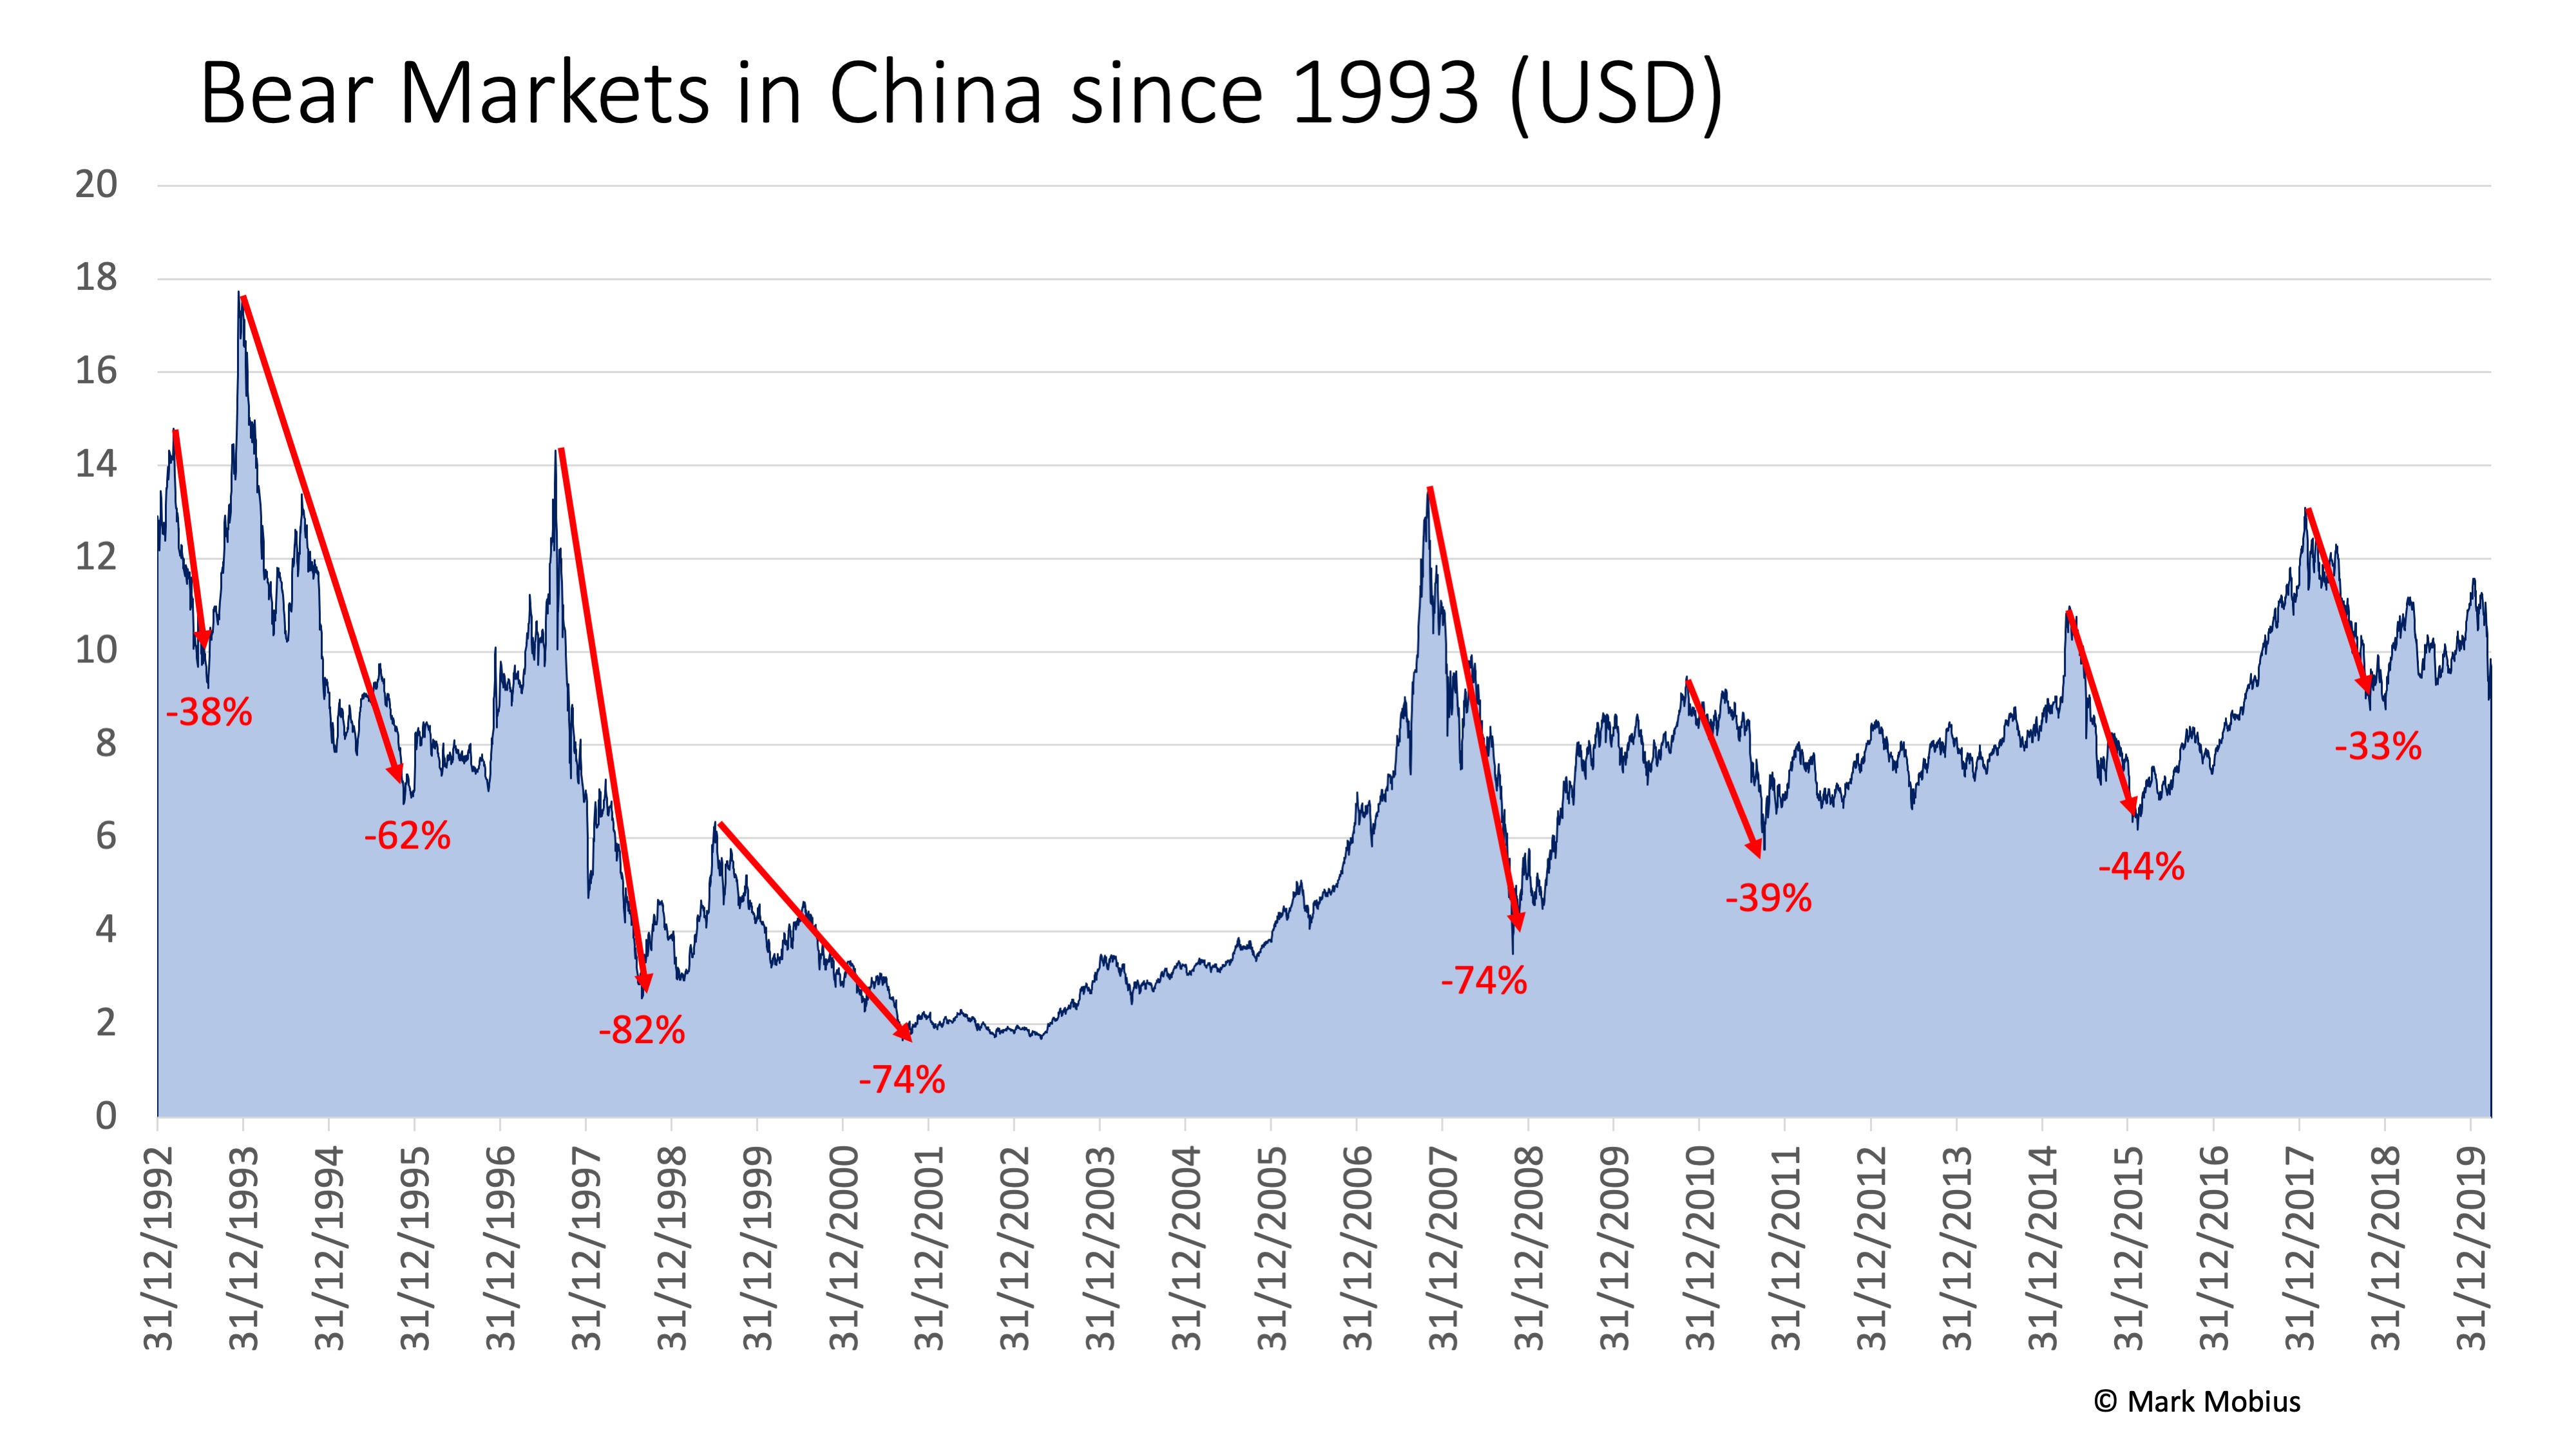
We found that the China market had a total of eight bear markets averaging a decline of 56% and ranging between a low of 33% to a high of 82%. The average length of time was 14 months with the longest period being more than two years and the shortest five months.

Taiwan
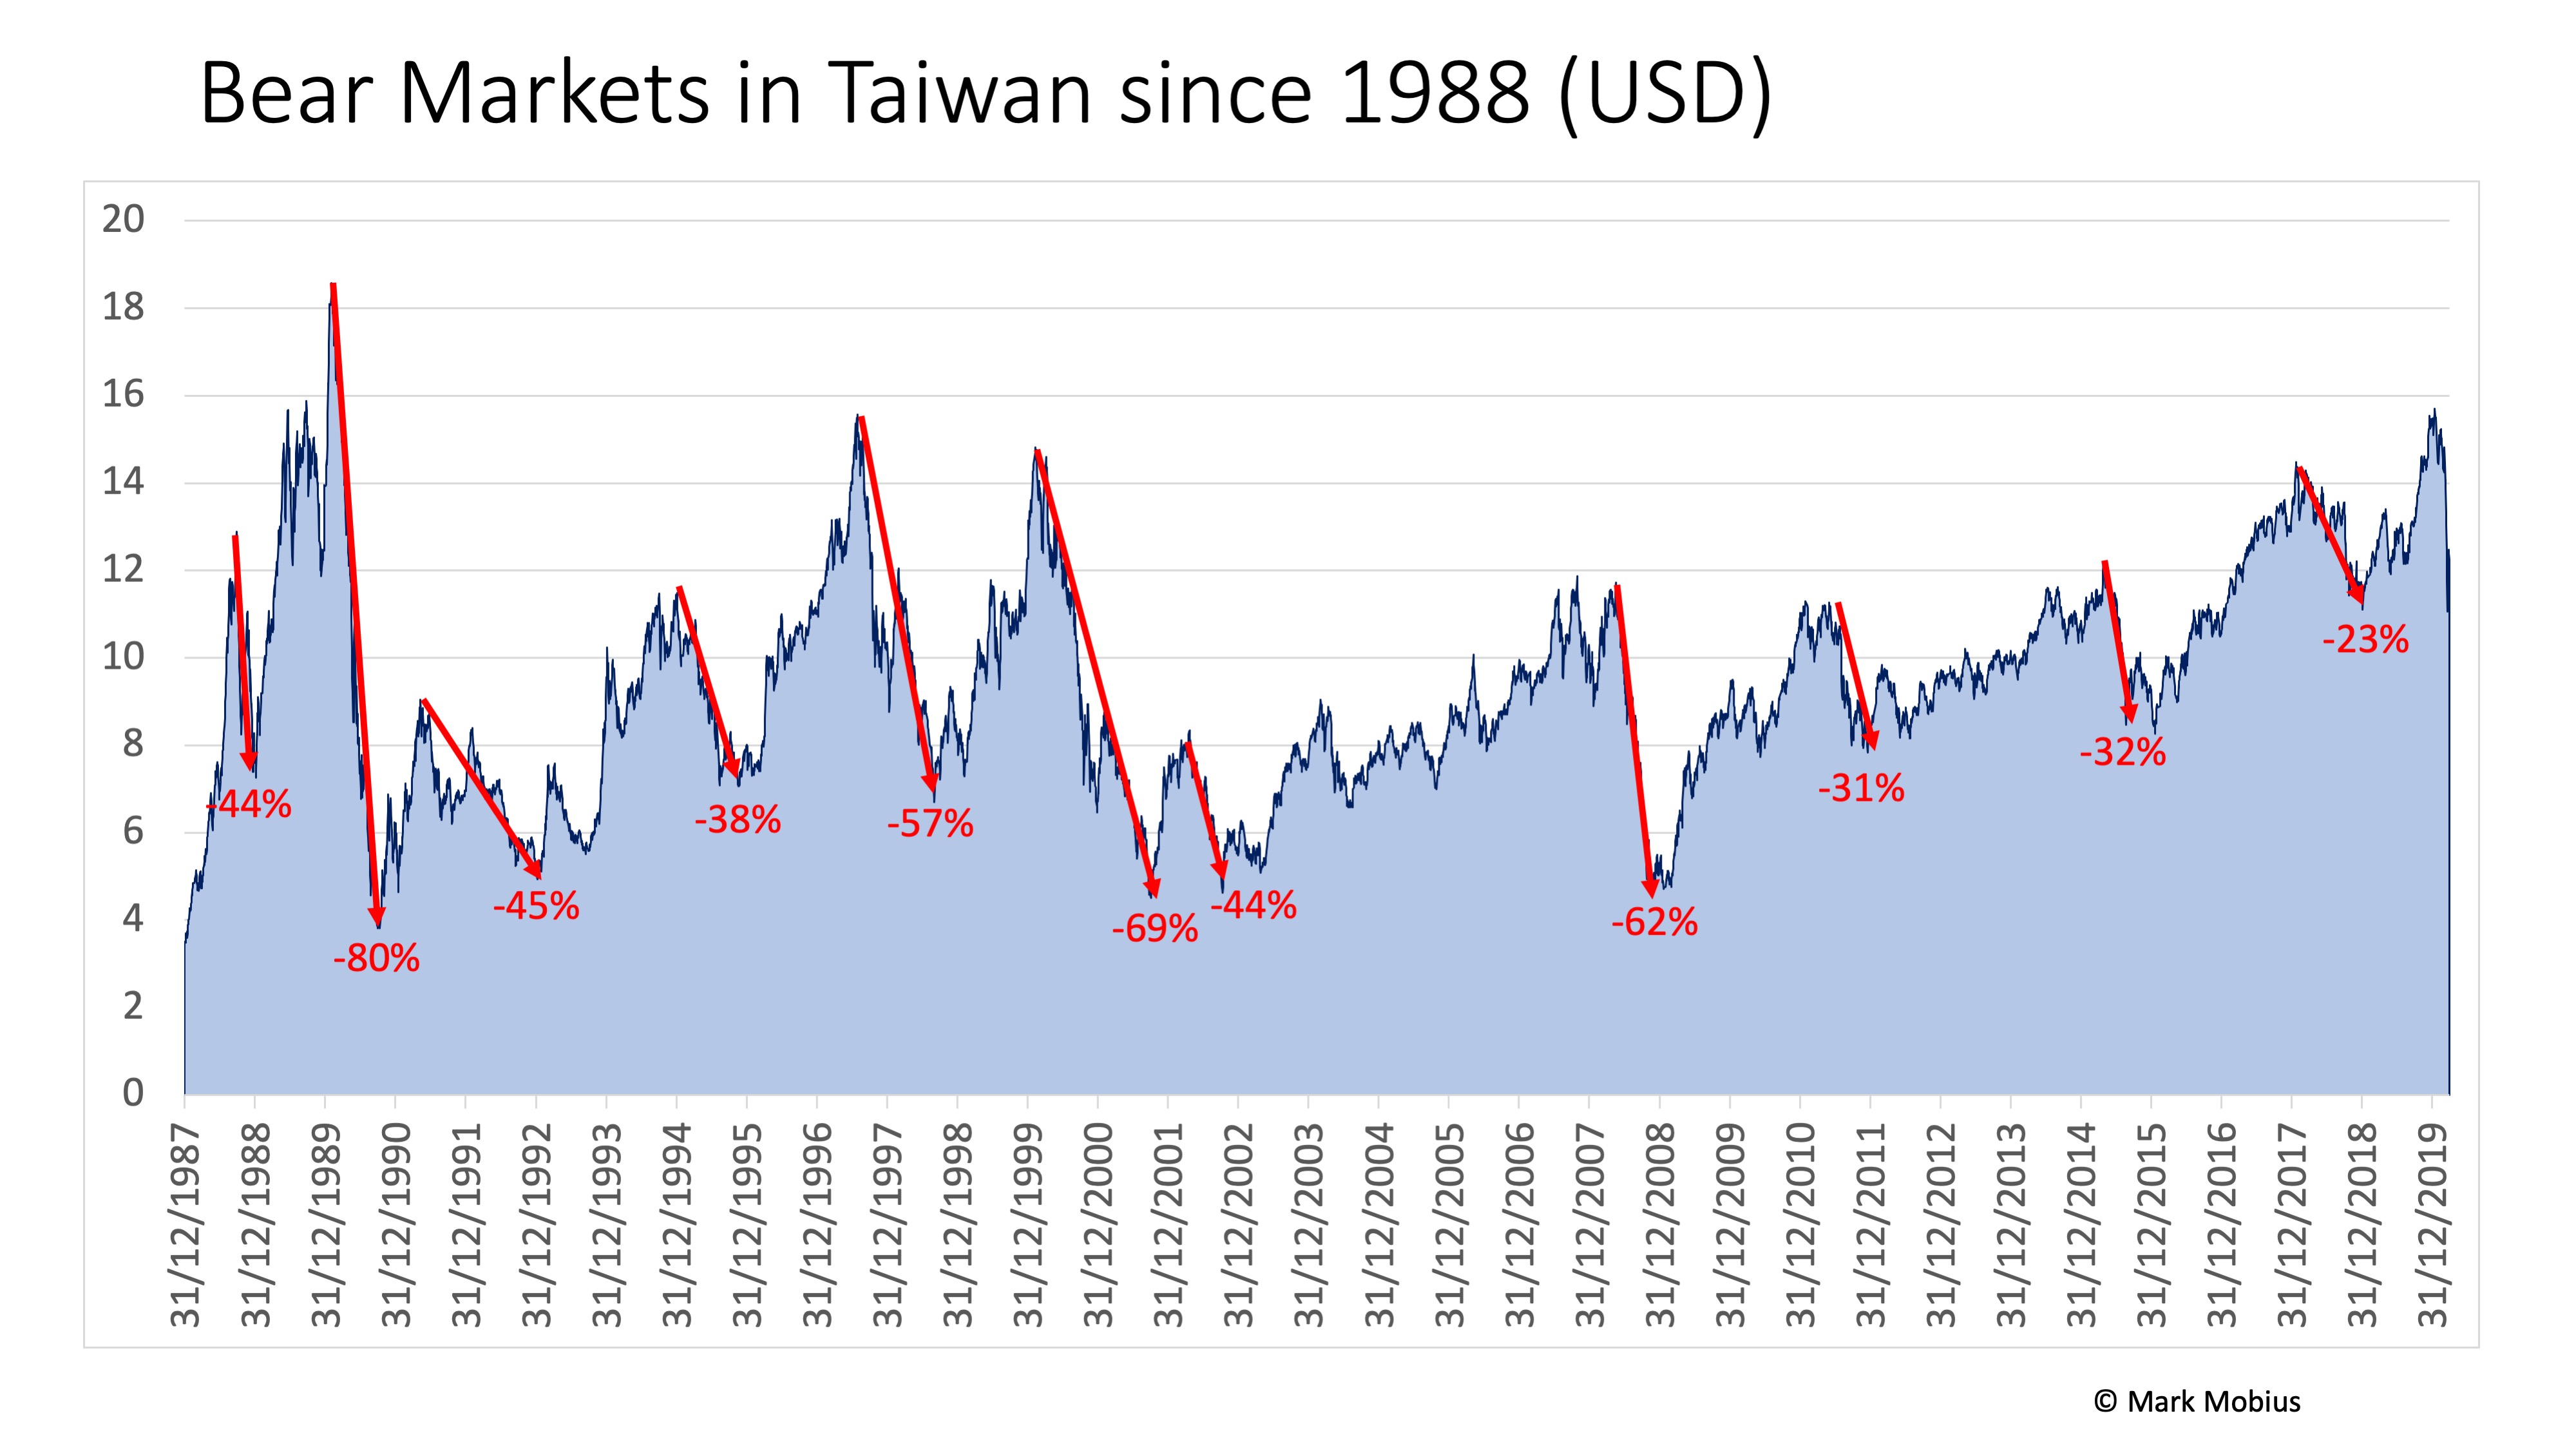
We would expect the Taiwan market with its economy so closely tied to China to perform similarly but that was not the case. The Taiwan market proved to be more volatile with 11 bear markets between 1988 and 2019. The average decline was lower than in China with 48% ranging between a high of 80% and a low of 23%. The length of the bear markets ranged between a few months and almost two years with the average being 11 months.

Brazil
The Brazilian market experienced 11 bear markets during the period averaging 56% decline and ranging between a decline of 75% and 35%. Average time length was 12 months ranging between a few months and almost three years.

India
In India, the market experienced nine bear markets averaging a decline of 44% ranging between a high of 71% and a low of 24%. The average time length for the Indian markets was a little over one year.

Japan
In Japan there were seven bear markets averaging a decline of 42% and ranging between a fall of 62% to 24%. The longest bear market in Japan lasted more than three years and the shortest 9 months with the average at 24 months.

Thailand
The Thai market was rather volatile with ten bear markets averaging a decline of 46% and ranging between a high fall of 92% and a low of 24%. The average length of time was nine months.

Hong Kong
The last market we looked at was the Hong Kong stock market, which witnessed eight bear markets since 1987. The average decline was 45% with a high of 64% and a low of 21%. The average length was 13 months.

What lessons can we draw from history?
So what can we learn from the above? We can see that on average bear markets declined by about 50%. The developed markets declined even less on average. In terms of the length, a bear market lasted on average more than a year. Bear markets in emerging markets were on average lasting shorter than bear markets in developed markets. This is important, as I believe the critical question is not only what the bottom is but how long it will last. You will need the cash reserves to continue to gradually buy and hold for what may seem like a long time.
So at what stage are we now? Most markets went down between 20 and 30% so much less than the average 50% we have seen above. The market swings have been wild on the upside and the downside. As I write this piece the indexes might already have moved higher or lower.
This kind of volatility is not unusual. If we look at the behaviour of the indices in bear markets we see that this sort of up and down is part of the game. So unfortunately the recent positive movement in many markets does not necessarily mean that we will see a continuous upward trend. There will always be backtracking and corrections along the way. This seems to be confirmed by the historical data from previous bear markets. However, the figures mentioned above are averages and averages are exactly that. The range can be wide. Many bear markets went down far less than 50% so it’s probably a good time to start nibbling but leave enough firepower to continue buying if the markets retreat more.
The full economic cost of the shutdowns around the world can not be accurately assessed and will, of course, be quite different from one industry to another and one company to another. We merely need to keep our eye on the long term developments and take an optimistic stance: Of the many years since 1987 when I’ve been investing in emerging markets all over the world I can say that there are two conclusions that I can confidently ascribe to: (1) all emerging markets experience bear markets, and (2) all emerging markets recover from those bear markets and experience a bull market. It’s very much like the conclusions of Arnold Toynbee, the famous historian and scholar of civilisations since ancient times. After all the years of study he said that there were two conclusions that he could ascribe to: First, all civilisations rise and, second, all civilisations fall. The wonderful thing about this phenomenon in emerging markets is that the rise and fall of the markets is relatively frequent and the bear markets tend to be shorter than the bull markets. So if you are a patient and disciplined investor you can purchase bargain stocks in the bear phases when everyone else is selling.
At the rate the coronavirus is spreading globally there might be worse to come but stock markets are starting to price that in. And given the efforts now undertaken by governments, central banks and scientists to contain the crisis I am confident we will see containment followed by a recovery on the horizon but as history teaches us it might not be for another one or two years.
ETF or Index Fund?
- When considering allocation to passive funds, it need not be to the exclusion of active funds. An investor can invest in both, active and passive funds. Don’t view passive funds as a competing strategy but rather, a complementary strategy.
- Investors should avoid passive funds based on mid- and small-cap themes. It is in these segments, which is often under-researched, that the potential to outperform the benchmark or generate alpha exists. Mid and small cap allocation can be in active funds.
- In ETFs, there is often a difference between the fair value of an ETF and the prices quoted on the exchanges. This is all the more evident if there is inadequate liquidity on the exchange. Hence investors should review the past trading volumes of an ETF before investing in it.
- Investors can also easily check the real-time INAV (indicative NAV) before executing a trade on the exchange – the INAV which indicates a real-time fair value per unit is mandatorily published on the website of the AMC. If a retail investor wants to exit and if he/she doesn’t get the fair value, then the overall investment experience is bad. Hence investors should look for ETFs where the divergence between INAV and the price traded is minimum.
- In an ETF, investors need to look beyond the total expense ratio, or TER. They must look at the total cost of ownership, or TCO. This includes all expenses (brokerage, taxes paid on buy and sell transactions on the stock exchange, annual demat account charges, bid/offer spread, etc.).